The first working iteration!
A tl;dr of the first post:
So to summarize the important technical details of that ~really~ long introduction post:
I got really into cross stitching as a form of stress relief when I first started in big tech and had some pretty wicked imposter syndrome. (At some point need to elaborate on my experience here – because it’s a huge contributor to “the leaky pipeline” for women in STEM fields 😞)
the goal:
Keeping track of progress on paper was messy and error-prone, so I wanted a program able to detect the grid of the cross stitch pattern, allowing me to mark stitches as incomplete or unmark them (when I made a mistake) with a simple mouse click.
onto the technical nitty gritty:
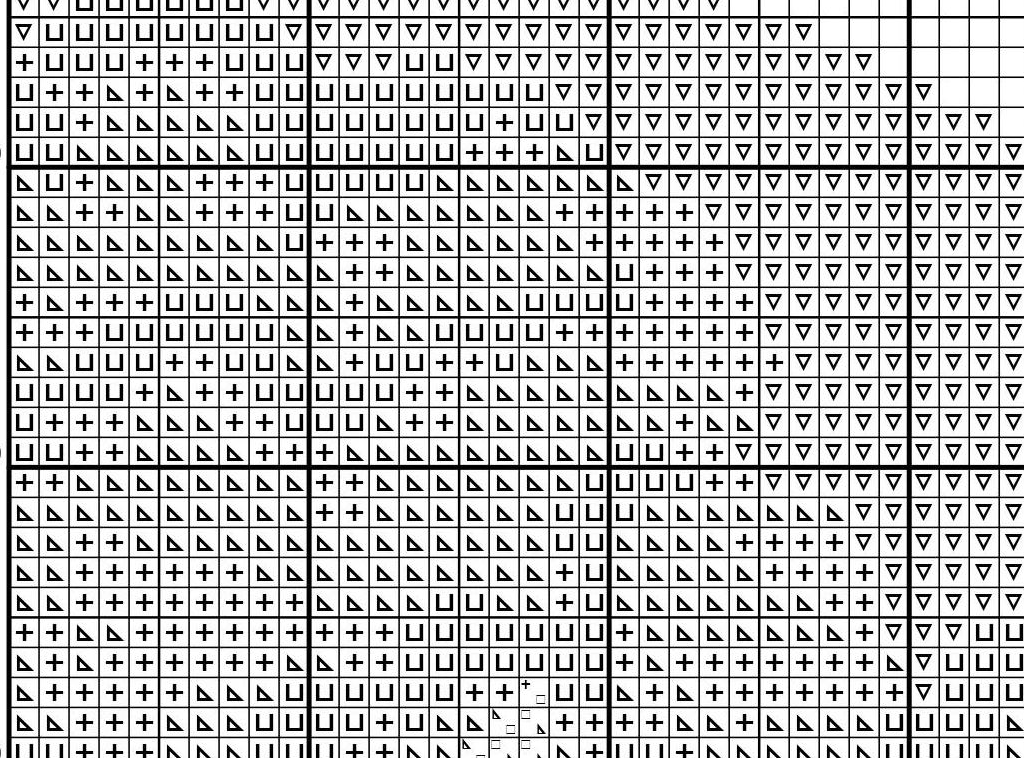
Since cross stitch patterns are essentially just large grids with symbols, this seemed achievable if I found a way to reliably detect the coordinates of lines on the grid.
After downing some iced coffee and scouring the internet, I discovered the concept of Hough Lines and the Open CV implementation.
Even better, it turned out using Hough Lines to detect the grid of a Sudoku puzzle (and later solve it) is a common beginner’s computer vision project. So there was definitely a precedent! Effectively, I was just working with one really big and detailed Sudoku puzzle 😅.
I discovered this tutorial and started working on my implementation.
a quick detour for an amateur explanation of Hough Transform:
Note: In the interest of keeping things accessible, this is a very broken down explanation..
Lines in a digital image are really just organized clusters of pixels – or points. For simplicity’s sake, let’s start with this grid representing a simple diagonal line in a monochrome image:
Going back to high school algebra, we can represent this line using the equation
Let’s consider some other lines which could pass through the point (0,0).
Now imagine we could represent all of the lines which pass through this given point as an equation
y = m(x) + b
0 = m(0) + b
Graphing that gets us the following:
Each of the intersections here represent points along the same line:
Hough Transform leverages this
Unfortunately.. in larger applications, this leaves us with a near unbounded line.
To optimize we use polar coordinates:
Hough Transform takes advantage of this by using the polar coordinate system to represent all of the lines which pass through a given point.
However,
applying our knowledge:
Now that we have an understanding of Hough Transform, let’s discuss impkemn